What Changes in a Multi-Vendor AMR Aisle: Up to Around 800 Transports per Hour with the Latest Robots and Software in 25 m × 3 m (Estimate)
Transport in e-commerce warehouses and manufacturing lines no longer runs on a single vendor’s AMRs.
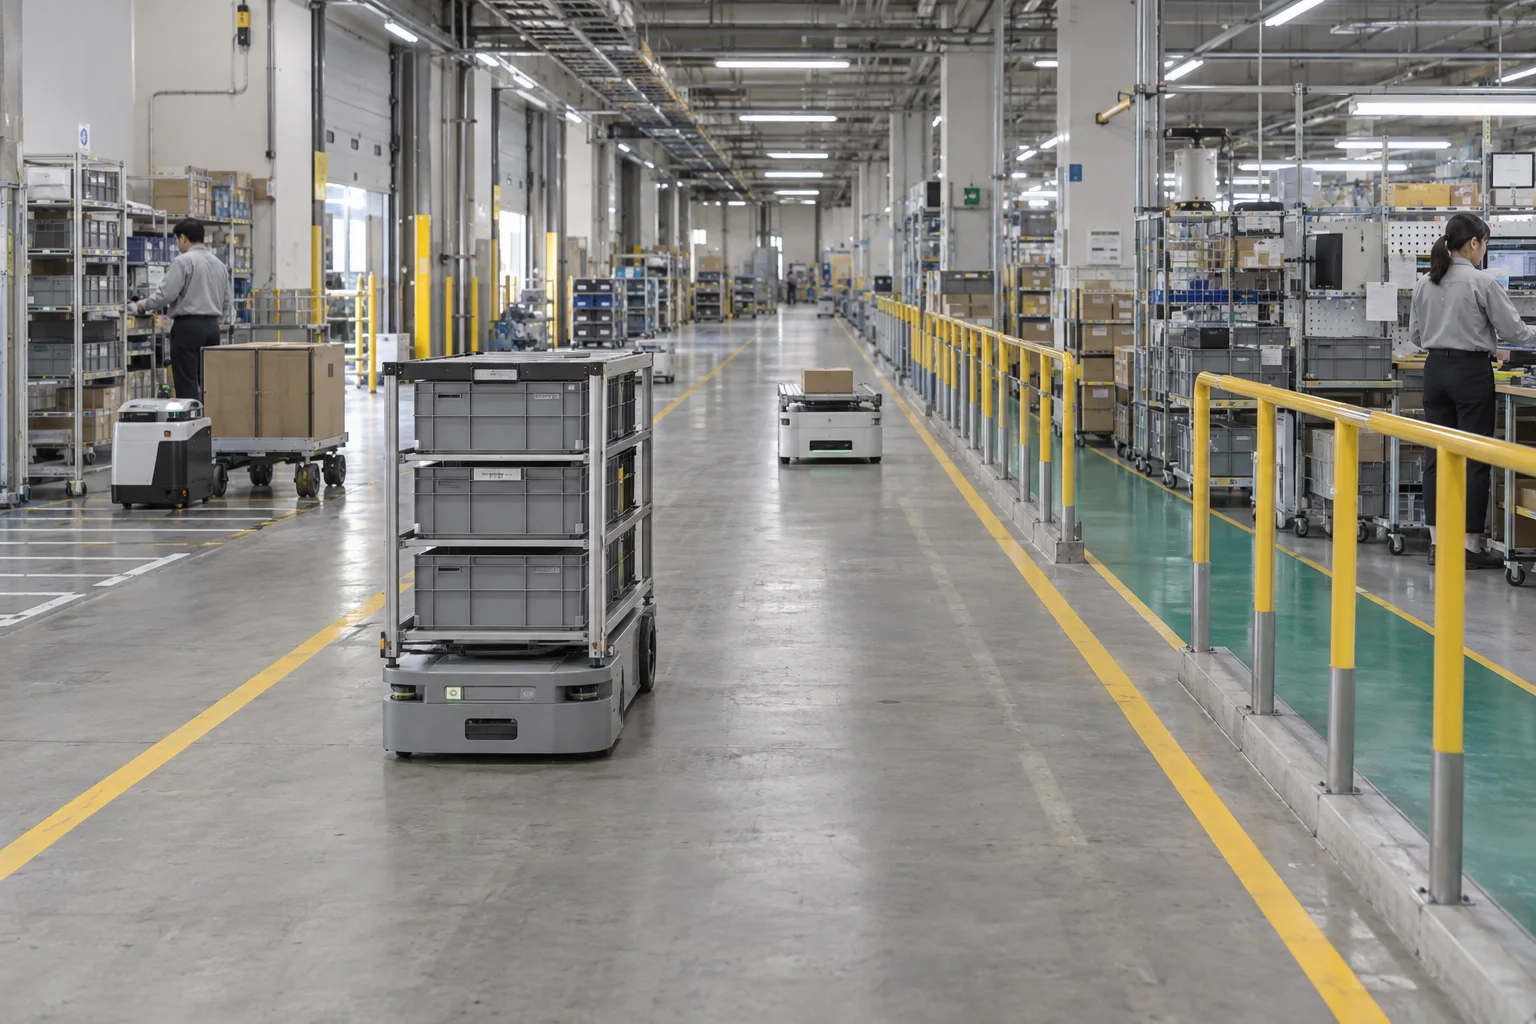
Tow tractors, under-shelf carriers, and small conveyor-top units come from different vendors, and the best robot for each job is rarely the same brand. Sites now have robots with different kinematics sharing one aisle while people walk between them. A manufacturing demonstration report published by Japan’s Ministry of Internal Affairs and Communications (MIC) in March 2026 shows one such site in numbers.
This article examines how far the latest robots and software could increase transport capacity compared with existing configurations. Up to around 800 transports per hour in an aisle roughly 3 m wide and 25 m long is the capacity envisaged for the latest configuration. The 12-robot example below yields an estimated 790 transports per hour, assuming a 15% interference loss.
Scope of this article
This is a configuration comparison based on public documents and a desk capacity model. It does not report BreakAI achieving 800 transports per hour. The figures are calculated under the assumptions stated in the text, and actual values are confirmed by site simulation and a pilot with real robots.
What the MIC demonstration reported
Under MIC’s FY2025 regional DX program, NTT East and Oki Electric Industry ran a demonstration of a multi-vendor transport robot management system and local 5G at Oki’s Honjo factory. The public summary and final report give the following results.
| Metric | Target | Result |
|---|---|---|
| Reduction in AMR management effort | 50% or more | 58.2% |
| Share of transport work taken over by AMRs | 30% or more | 68.8% |
| AMR downtime caused by communication | 0% | 0% |
| Local 5G positioning within 3 m error | all points | 54.9% of measured points |
The report lists “expanding AMR vendors and system integration, targeted for March 2027” as a remaining rollout issue.
That is what the public documents establish. The demonstration evaluated the consolidation of per-vendor AMR management and maps into one system. Path planning and traffic control methods were not part of the evaluation.
From here on, this is BreakAI’s hypothesis. We expect that a site whose management effort and transport substitution have improved through integrated management will next run into the aisle’s traffic capacity as transport frequency rises. At a density like 800 transports per hour, throughput depends on control quality: which robot yields when, where it turns around, and who slows down when a person crosses. As described below, this hypothesis is tested by comparison simulations against rule-based control and by a pilot with real robots.
Current products versus the latest configuration
The table sets the configuration running on sites today beside what the latest robots and software allow.
| Item | Current products | Latest robots and software |
|---|---|---|
| Robot connection | Vendor-specific fleet manager; other brands on separate screens | Common connection via VDA5050; proprietary APIs absorbed by adapters |
| Map | Built and corrected per vendor | One map learned by one robot, shared across vendors |
| Routes | Fixed routes and a uniform speed limit | Multi-agent path planning that includes kinematics (turning method, acceleration, body length) |
| Traffic control | Per-section priority rules and mutual exclusion | Control policies trained per robot type decide timing within the plan’s constraints |
| Coexistence with people | Uniform slowdown across the aisle | Lower speed caps only in high-crossing sections; stop propagation measured |
| Purchase decision | Catalog values and fleet-size rules of thumb | Simulation with site drawings and pedestrian flow to compare fleet size, mix, and layout |
Map sharing and connection integration already exist as products, as the MIC demonstration shows. VDA5050 is an MQTT-based standard connecting fleet managers and robots. MiR has released a VDA5050 adapter, and Seegrid has announced full compliance targeted for 2026.
The lower half of the table (routes, traffic control, coexistence, purchase decision) is where sites still differ widely.
What differs between vendors
Putting robots from different vendors in one aisle brings these differences into the traffic.
- Differential-drive robots take time to rotate in place, and their footprint changes while turning.
- Omnidirectional robots can move sideways without turning, but their speed and payload differ.
- Tow tractors have a large turning radius and occupy the aisle with the full length of their carts.
- Acceleration, stopping distance, sensor detection fields, and communication latency all vary by vendor.
With the uniform speed limit and priority rules of the current configuration, the fleet runs at the pace of the slowest robot. Handling each robot’s characteristics at planning time changes the fleet size needed in the same aisle width. In the capacity model below, kinematic differences alone move the required fleet by 2 to 5 robots.
The three layers of the latest configuration
BreakAI’s configuration has three layers.
1. Connection layer: absorbing vendor APIs
VDA5050-compliant robots connect directly. Robots with proprietary APIs go through adapters into the same order and state model. Each unit’s kinematics (maximum speed, acceleration, turning method and time, body dimensions, tow length) is held explicitly as a robot profile.
2. Planning layer: multi-agent path finding with kinematics
Planning paths for many robots at once (MAPF) is the core technology behind Rovnou, which BreakAI took to 6th place in the League of Robot Runners 2026.
Real robots cannot execute grid plans directly. Research on non-holonomic robots includes MAPF-POST, which converts plans into execution schedules with velocity limits, TP-SIPPwRT, which includes rotation time directly in planning, and MASS (AAAI 2025), which improved throughput for differential-drive robots through stationary state search. BreakAI builds on this lineage and puts each robot profile’s constraints into one shared plan.
The planning layer gives each robot a spatial path and a time window in which it may pass each section. Collision and deadlock avoidance rest on these windows not overlapping.
3. Control layer: control policies trained per robot type
Even a correct plan meets people crossing, delayed handling, and other robots stopping at execution time. This is where local control policies trained for each robot’s kinematics matter.
- For differential-drive robots: approach angles and waiting positions that reduce turning delays
- For omnidirectional robots: overtaking and yielding using sideways motion
- For tow tractors: earlier deceleration and turnaround bay selection
Training uses centralized training with decentralized execution (CTDE). A group at the Beijing Institute of Technology reported that a policy formulated as a partially observable MDP and trained with an improved PPO variant shortened travel distance and time in dynamic environments.
A control policy can only change what lies inside the planning layer’s constraints.
- It does not change the spatial path. It can change the speed profile and waiting time within a section, and choose among turnaround bays and waiting positions the planning layer offered as candidates.
- When it is about to exceed the planning layer’s time window, it requests replanning instead of proceeding on its own.
- In any abnormal situation, the robot’s own safety functions and safety stop take priority.
The guarantees shown by MAPF-POST and related work apply to the plan’s execution schedule. They do not amount to a guarantee of uninterrupted operation or safety for the whole system of learned control plus real robot safety functions. Safety and recovery performance after stops are verified in a pilot with real robots.
Conditions for people and AMRs sharing an aisle
Where people and AMRs share an aisle, speed and detection-field design map directly to safety requirements.
ISO 3691-4 is the safety standard for driverless industrial truck systems. The 2023 second edition added detailed requirements for active detection fields and operational stops, and describes the conditions under which speed can be raised in restricted zones. In Japan, the Ministry of Health, Labour and Welfare’s guideline for autonomous transport robot safety and the commissioned AMR test protocol lay out risk assessment procedures.
The latest configuration includes the following in the design.
- Compare in simulation whether the 3 m aisle should separate a walking lane from robot lanes or mix them.
- Lower the planning-layer speed cap in sections with frequent crossings, and train the control layer to decelerate earlier there.
- Let the planning layer decide restart order after stops, and measure how far a crossing-induced stop propagates to following robots.
- Acquire person and robot positions through Wi-Fi, UWB, or local 5G depending on the site’s communication conditions.
In the MIC demonstration, local 5G positioning was within 3 m at 54.9% of measured points. Because positioning accuracy varies by site, BreakAI does not depend on it, relying primarily on robot-side sensing and section speed control in the planning layer.
Putting 25 m × 3 m and 800 transports per hour into numbers
Converting the target into numbers shows where the two configurations diverge.
| Item | Value |
|---|---|
| Target throughput | 800 transports per hour |
| System-wide interval between completed transports | 4.5 seconds |
| Aisle area | about 75 square meters |
Somewhere in the aisle, a transport must complete every 4.5 seconds. This is a question of the aisle’s traffic capacity, not of one robot’s performance.
Layout assumed
The calculation uses the following layout.
- The aisle is used as a one-way loop, with the 3 m width divided into an outbound lane, a return lane, and a walking lane.
- Handling stations sit at both ends of the aisle, and robots stay in their lane while handling.
- Average one-way distance 12.5 m, handling 10 seconds at each end.
- Cycle time per robot = round-trip travel time (including acceleration) + 20 seconds handling + turning time.
Fleet size by kinematics
| Kinematics | Cycle per robot | Robots needed (no interference) |
|---|---|---|
| Differential drive, 1.0 m/s, 2 s in-place turn | 53 s | 12 |
| Differential drive, 1.5 m/s, 2 s in-place turn | 47 s | 11 |
| Omnidirectional, 1.2 m/s, no turn | 46 s | 11 |
| Tow tractor, 1.0 m/s, 6 s turn | 64 s | 15 |
If the one-way distance grows to 25 m, the fleet grows to 14 to 21 robots. Varying handling between 8 and 12 seconds moves each row by 1 to 2 robots.
Spacing in the lane
In a one-way loop, the robots split evenly between the outbound and return lanes. Spacing per lane follows from:
Spacing per lane = lane length 25 m ÷ (total robots ÷ 2)
| Total robots | Per lane | Spacing | Gap at 1.2 m/s |
|---|---|---|---|
| 10 | 5 | 5.0 m | 4.2 s |
| 12 | 6 | 4.2 m | 3.5 s |
| 16 | 8 | 3.1 m | 2.6 s |
Two intervals need to be kept apart. The system-wide interval between completed transports is 4.5 seconds. The interval at which robots pass a cross-section of one lane is, for the 12-robot configuration, a 46 second cycle ÷ 6 robots ≒ 7.7 seconds. A 3 to 4 m gap in the lane is about the same length as the stopping distance at 1.2 m/s plus the ISO 3691-4 detection field, a density at which one robot’s stop reaches the next robot almost immediately.
With the uniform slowdown and fixed routes of the current configuration, the only option is to widen that gap for safety, and added robots no longer fit in the aisle. The latest configuration works toward holding this density by reducing turning waits through kinematics-aware planning and by shortening stop propagation through trained control. How much it helps is measured in the simulation below.
Example configuration: 12 robots, mixed fleet
To match the cost example that follows, one configuration is fixed here.
| Item | Value |
|---|---|
| Fleet | 12 robots (8 differential drive at 1.5 m/s, 4 omnidirectional at 1.2 m/s) |
| Average cycle | 46 s |
| Theoretical throughput without interference | about 930 transports per hour |
| Throughput assuming a 15% interference loss | about 790 transports per hour |
The 15% interference loss is an assumption, to be replaced by simulation results that include crossing frequency, stop propagation, and handling delays. Eight robots give about 620 transports per hour even in theory, short of 800.
What the simulation compares
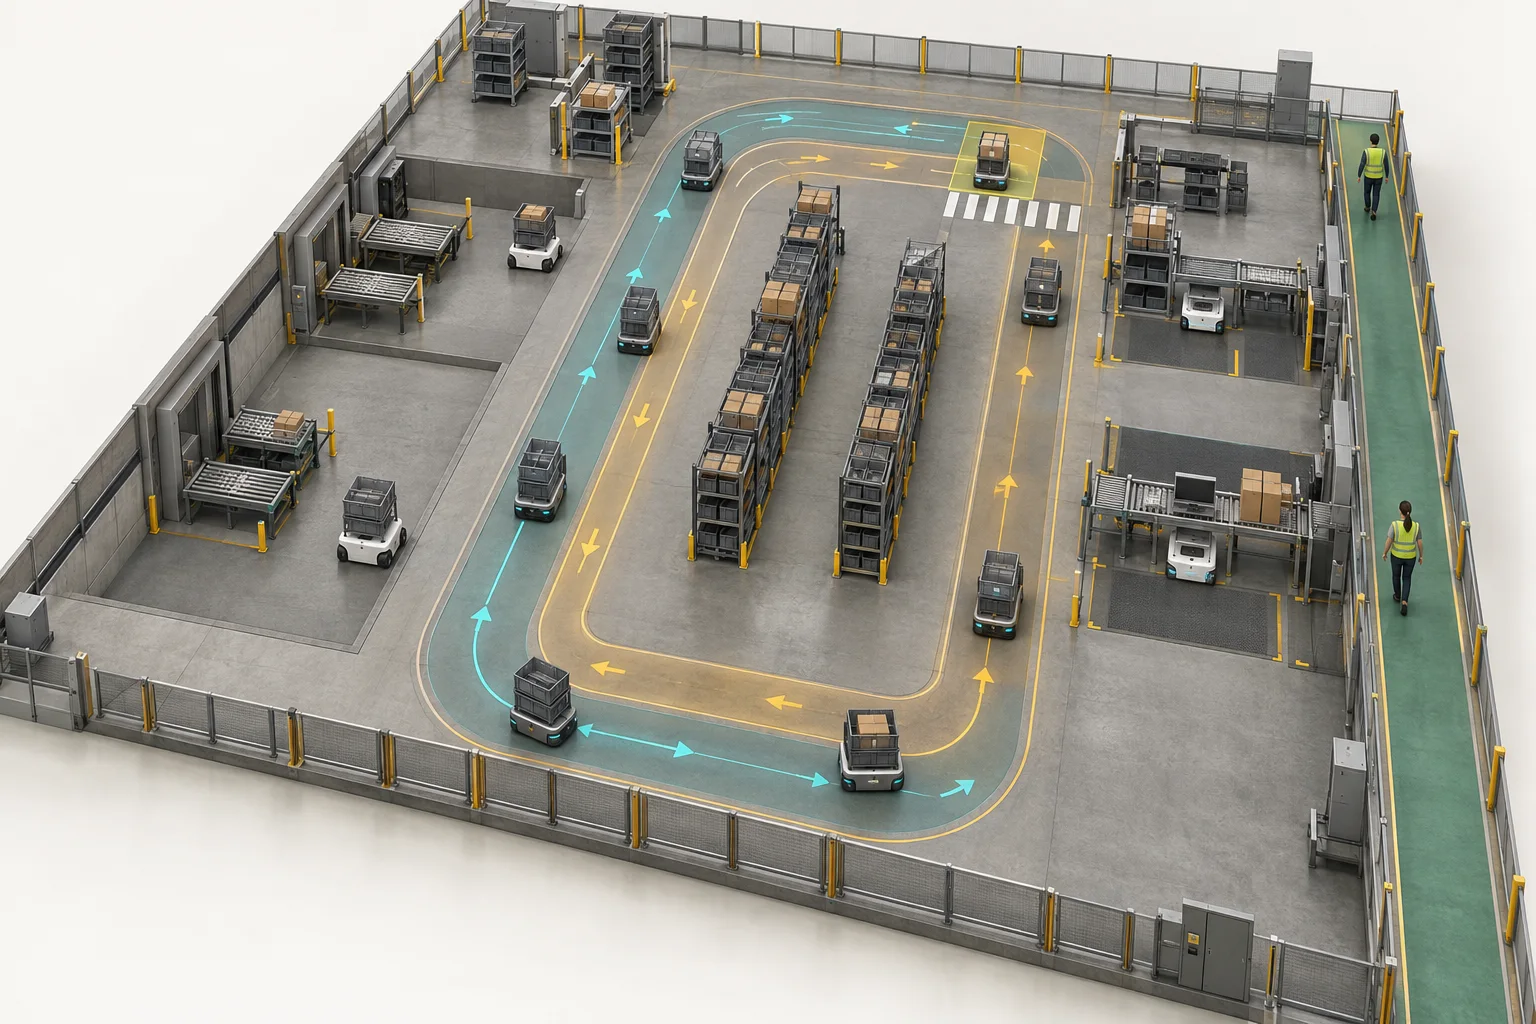
BreakAI’s simulation study takes site drawings and robot profiles as input and produces the following.
- Throughput curves per fleet size and vendor mix: how many robots reach 800 per hour, and where congestion flattens the curve
- Rule-based control versus trained control policies: swapping only the control layer on the same planning layer and comparing throughput, number of stops, and recovery time under identical conditions
- Sensitivity to crossing frequency and location, including how far a crossing-induced stop propagates
- Counts of deadlocks, stops, and recoveries
- Comparison of lane configurations: separated or mixed, one-way or two-way
Trained control is adopted only if this comparison shows a difference. If it does not, the site keeps rule-based control and the study settles only fleet size and layout.
Academic work on mixed human-AMR picking reports, for example, that efficiency peaks at roughly a 2:1 AMR-to-picker ratio. Because optimal ratios and layouts differ by site, each site needs its own simulation.
Results are organized so the customer can decide one of: buy this configuration, reduce the fleet, fix the layout, or pass.
Implementation cost
Initial costs start from 50 million yen, with a tailored quote based on the target area, robot configuration, and integration with existing equipment. Detailed pricing, including operation and maintenance costs, is provided during consultation.
BreakAI does not promise a fixed improvement rate up front. Simulation produces the numbers first, and those numbers become the acceptance criteria for deployment.
How the engagement proceeds
- Fit check (free, 20 to 30 minutes): review transport frequency, aisle drawings, candidate vendors, and pedestrian flow, and estimate whether the target is feasible for the aisle capacity.
- Simulation study (paid): model the site and deliver comparisons across fleet size, vendor mix, layout, pedestrian flow, and control method, with acceptance criteria.
- Pilot (paid): put real robots in one section, connect the planning and control layers, and measure throughput, safety stops, and recovery time against the simulation.
- Deployment and rollout: deploy the configuration that meets the acceptance criteria and extend it to other aisles and sites.
In the pilot, BreakAI confirms existing equipment, emergency stops, safety functions, communication loss handling, and the division of responsibility with workers before sending commands to real robots.
Sites this fits
- Several vendors’ AMRs are deployed or planned, with separate management screens per vendor
- Aisle width is limited, and people and robots share the same aisle
- Transport frequency is high, and congestion, waiting, and manual recovery happen daily
- Transport logs, site drawings, and robot specifications can be shared
- A site manager and an equipment or systems owner can join the study
For sites with low transport volume served by one vendor, or where people can be fully separated from robots, the latest configuration is more than needed. There, BreakAI recommends an integrated management system or a review of the existing fleet manager’s settings first.
Discuss a multi-vendor AMR transport system
With the aisle dimensions, transports per hour, candidate vendors, and pedestrian flow, the initial fit check can give you a rough aisle capacity estimate.
Contact BreakAI
References
- MIC: Demonstration of an efficient and flexible production system using a multi-vendor transport robot management system (summary)
- MIC: Final report of the same demonstration (NTT East, March 2026)
- MiR: VDA 5050 adapter announcement
- Seegrid: VDA5050 support announcement
- Hönig et al.: Multi-Agent Path Finding with Kinematic Constraints (ICAPS 2016)
- Ma et al.: Lifelong Path Planning with Kinematic Constraints for Multi-Agent Pickup and Delivery (AAAI 2019)
- Yan et al.: Multi-Agent Motion Planning for Differential Drive Robots Through Stationary State Search (AAAI 2025)
- Beijing Institute of Technology: Multi-agent policy learning-based path planning for autonomous mobile robots
- Garg & Maywald: Simulation of mixed human-AMR picking (WSC 2021)
- Pilz: What changed in ISO 3691-4:2023
- MHLW: Guideline for safety of autonomous transport robots
- MHLW-commissioned: AMR safety and test protocol